library(RcppOctave)
## define a Gamma RNG draw function
o_source(text="
function x = orngg(a, b, n)
x = b * randg(a, n, 1);
end
")
N <- 50000
set.seed(42)
x1 <- c(.O$orngg(9,1,N))
x2 <- c(.O$orngg(4,1,N))
x3 <- c(.O$orngg(1,4,N))
set.seed(42) # reset RNG
y1 <- rgamma(N,9,1)
y2 <- rgamma(N,4,1)
y3 <- rgamma(N,1,1,4)
Error in rgamma(N, 1, 1, 4): specify 'rate' or 'scale' but not both#NOTE: RcppOctave's Octave function randg already has a scale parameter:
set.seed(42)
z1 <- c(.O$randg(9,N,1,1))
z2 <- c(.O$randg(4,N,1,1))
z3 <- c(.O$randg(1,N,1,4))
stopifnot(all.equal(x1,z1))
stopifnot(all.equal(x2,z2))
stopifnot(all.equal(x3,z3))
# see also wrapper function ?o_rgamma, that is more similar to the other o_* RNG functions
# in term of parameter order.
stopifnot(all.equal(x1,y1))
stopifnot(all.equal(x2,y2))
stopifnot(all.equal(x3,y3))
Error in mode(current): object 'y3' not foundop <- par(mfcol=c(2,1), lwd=2, mar=c(4,3,3,1))
plot(density(x1), main="Calling randg from Octave",
col="orange", ylim=c(0,0.23), xlim=c(-1,22))
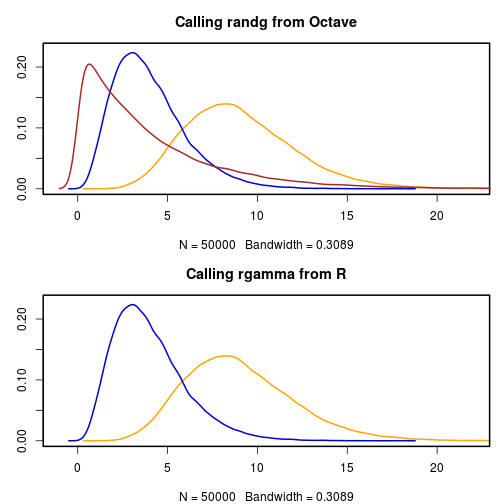
lines(density(x2), col='mediumblue')
lines(density(x3), col='brown')
plot(density(y1), main="Calling rgamma from R",
col="orange", ylim=c(0,0.23), xlim=c(-1,22))
lines(density(y2), col='mediumblue')
lines(density(y3), col='brown')
Error in density(y3): object 'y3' not foundpar(op)